
Briefings
Briefings detailing how ecological restoration policy and practice can support complex and resilient ecosystems have been produced for policy makers and conservation practitioners. These briefings relate the findings of RestREco to current legislation and best practice to come up with a set of policy and management recommendations.
Scientific articles
Rogerson, S.P., Waddell, E.H., Park, K.J., Fuentes-Montemayor, E., Watts, K., Bullock, J.M., Harris, J., Guy, M., Barnett, R.J., Weites, M.G., Shears, M., Opris, A.D. and Woodcock, B.A. (2026). Drivers of invertebrate community assembly during ecosystem restoration. Restoration Ecology, e70527.
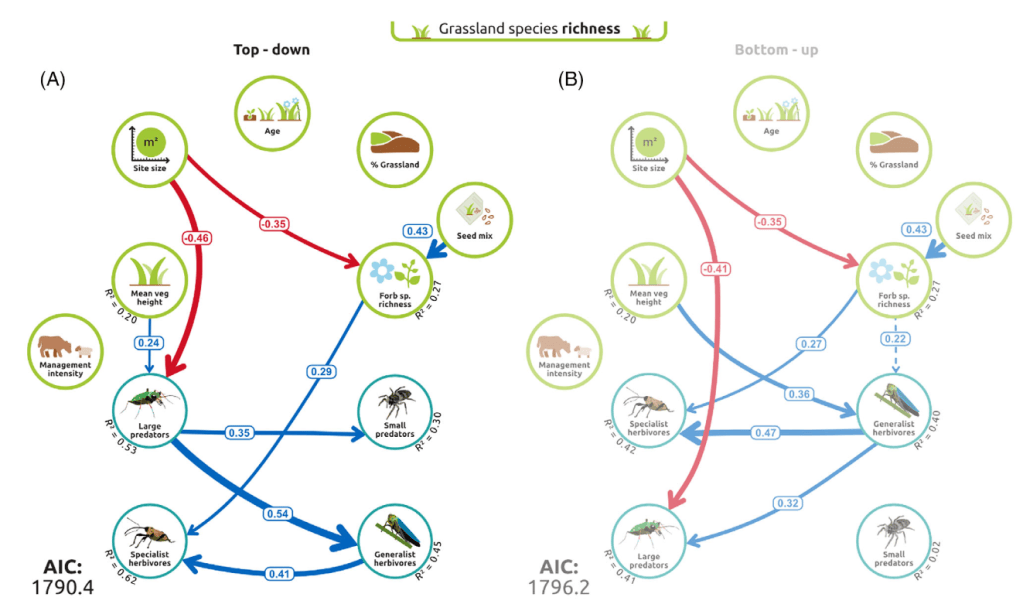
Figure 1: Grassland structural equation models showing top-down and bottom-up processes for species richness
Waddell, E. H., Woodcock, B., Harris, J., Park, K. J., Fuentes- Montemayor, E., Watts, K., Pawlett, M., Larionov, A., Guy, M., Rogerson, S. P., Barnett, R. J., Weites, M. G., Shears, M., Hibdige, S., Aguinaga, O., Roxbee Cox, L., Feeley, E., Opris, A. D., Gee, A., … Bullock, J. (2026). Drivers of complexity in ecosystem restoration. Journal of Applied Ecology, 63, e70387.
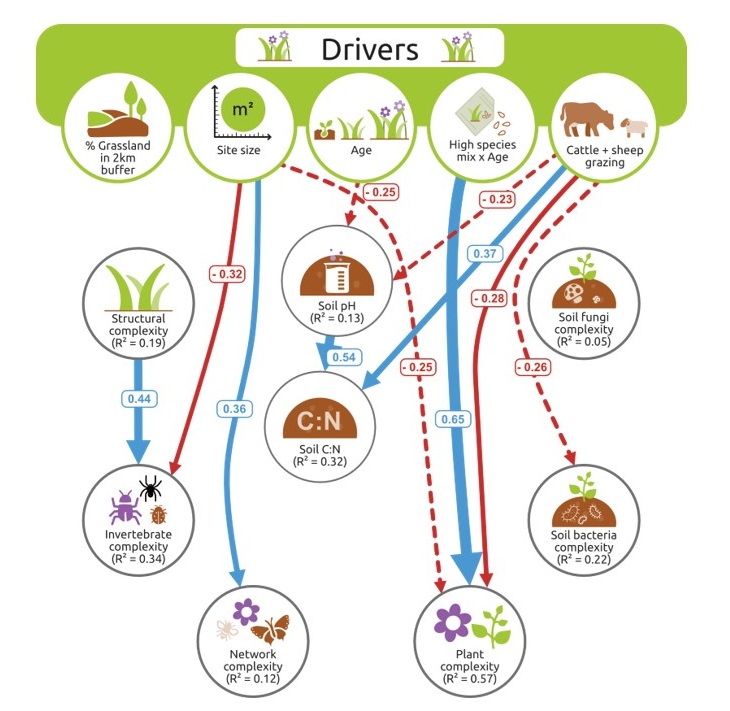
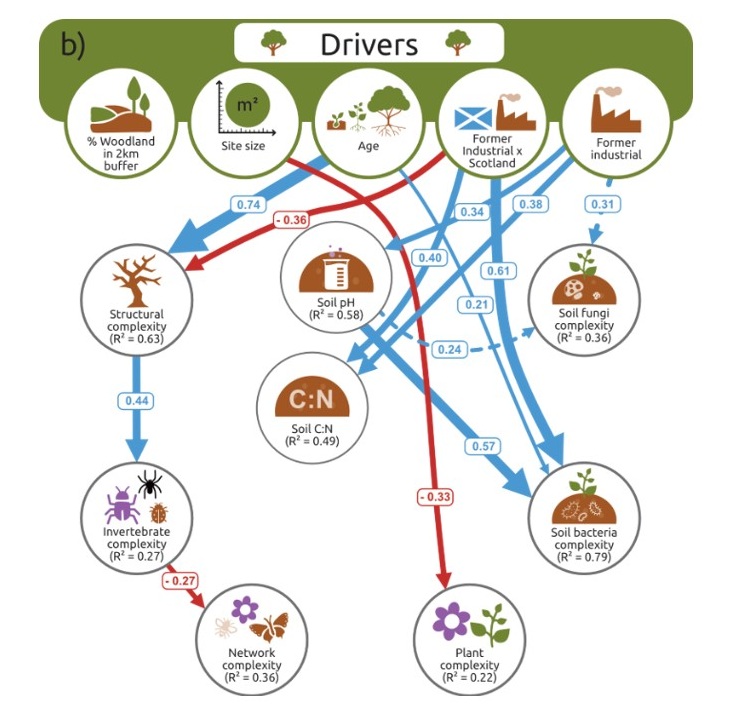
Figure 2: Structural equation model showing the supported drivers of ecological complexity within restoring (a) calcareous grasslands and (b) broadleaved woodlands. Model test statistics for grasslands: Fisher’s C = 60.97; p = 0.94; df = 80, and woodlands: Fisher’s C = 77; p = 0.57; df = 80. Positive relationships are shown with blue lines, and negative relationships with red. Significant relationships (p < 0.05) are solid lines and marginally significant (p < 0.1) are dashed lines. Numbers are the standardised path coefficients from the SEM, which are also reflected in the line width. R2 values are shown for each endogenous variable in the SEM.
Woodcock, B.A., Waddell, E., Weites, M.G., Guy, M., Freeman, M., Park, K., Fuentes-Montemayor, E., Watts, K., Barnett, R.J., Rogerson, S. l., Opris, A., Harris, J., Bullock, J.M. (2026) Restoration of ecological interactions: The influence of site and landscape factors. Agriculture, Ecosystems & Environment, 397, 110060.
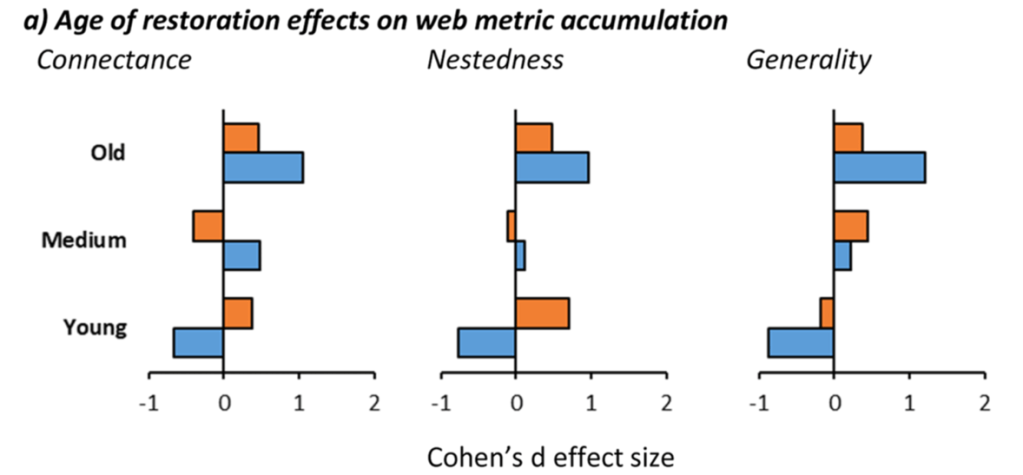
Figure 3: Accumulation of bipartite web metrics according to whether sites were drawn from groupings based on age (young, middle or old)
Bullock, J.M., Fuentes-Montemayor, E., McCarthy, B., Park, K., Hails, R.S., Woodcock, B.A., Watts, K., Corstanje, R. & Harris, J. (2021) Future restoration should enhance ecological complexity and emergent properties at multiple scales. Ecography

Figure 4: A conceptual diagram depicting increasing degrees of ecological complexity within a system. As the number of components and connections increases so does complexity (Box 1). As complexity increases, so do emergent properties such as ecosystem functioning and resilience. In this case, an ecosystem is depicted, and the progression from left to right could be a restoration trajectory, but the same principles apply at multiple scales (Fig. 2).
Magazine articles
RestREco project collaborated on this special issue of IES‘s environmental SCIENTIST journal on ecosystem restoration. The articles within were written by consortium members and project partners on a wide range of topics including challenges of setting & achieving goals in restoration, policy frameworks, restoring for ecosystem complexity and lots of case studies.
The woodland team wrote an article entitled “Rethinking Woodland Restoration” in the Woodland Trust Autumn 2022 Wood Wise Magazine on Nature Recovery at Scale.
Related scientific articles

Woodcock, B.A., Pywell, R.F., Macgregor, N.A., Edwards, M.E., Redhead, J., Ridding, L.E., Batáry, P., Czerwiński, M. & Duffield, S. (2021) Historical, local and landscape factors determine the success of grassland restoration for arthropods. Agriculture, Ecosystems & Environment, 308, 107271.
Fig. 4. Response of arthropod communities to the success with which the restoration sites replicated target floral communities typical of high quality species rich grasslands measured using Jaccard’s similarity. .

